
State Agencies
County and City Resources
Economic/Business Development Agencies
Workforce Development
Chambers: and other business organizations:
Networking
Incubators/Office Spaces
FACCGN Document/Resources
There is no single 2025 data source that cleanly breaks out Filipino American–owned businesses in Nevada by detailed industry, but available statistics let us sketch a reasonable profile and give you working numbers with caveats:
Filipino American population in Nevada (2025)
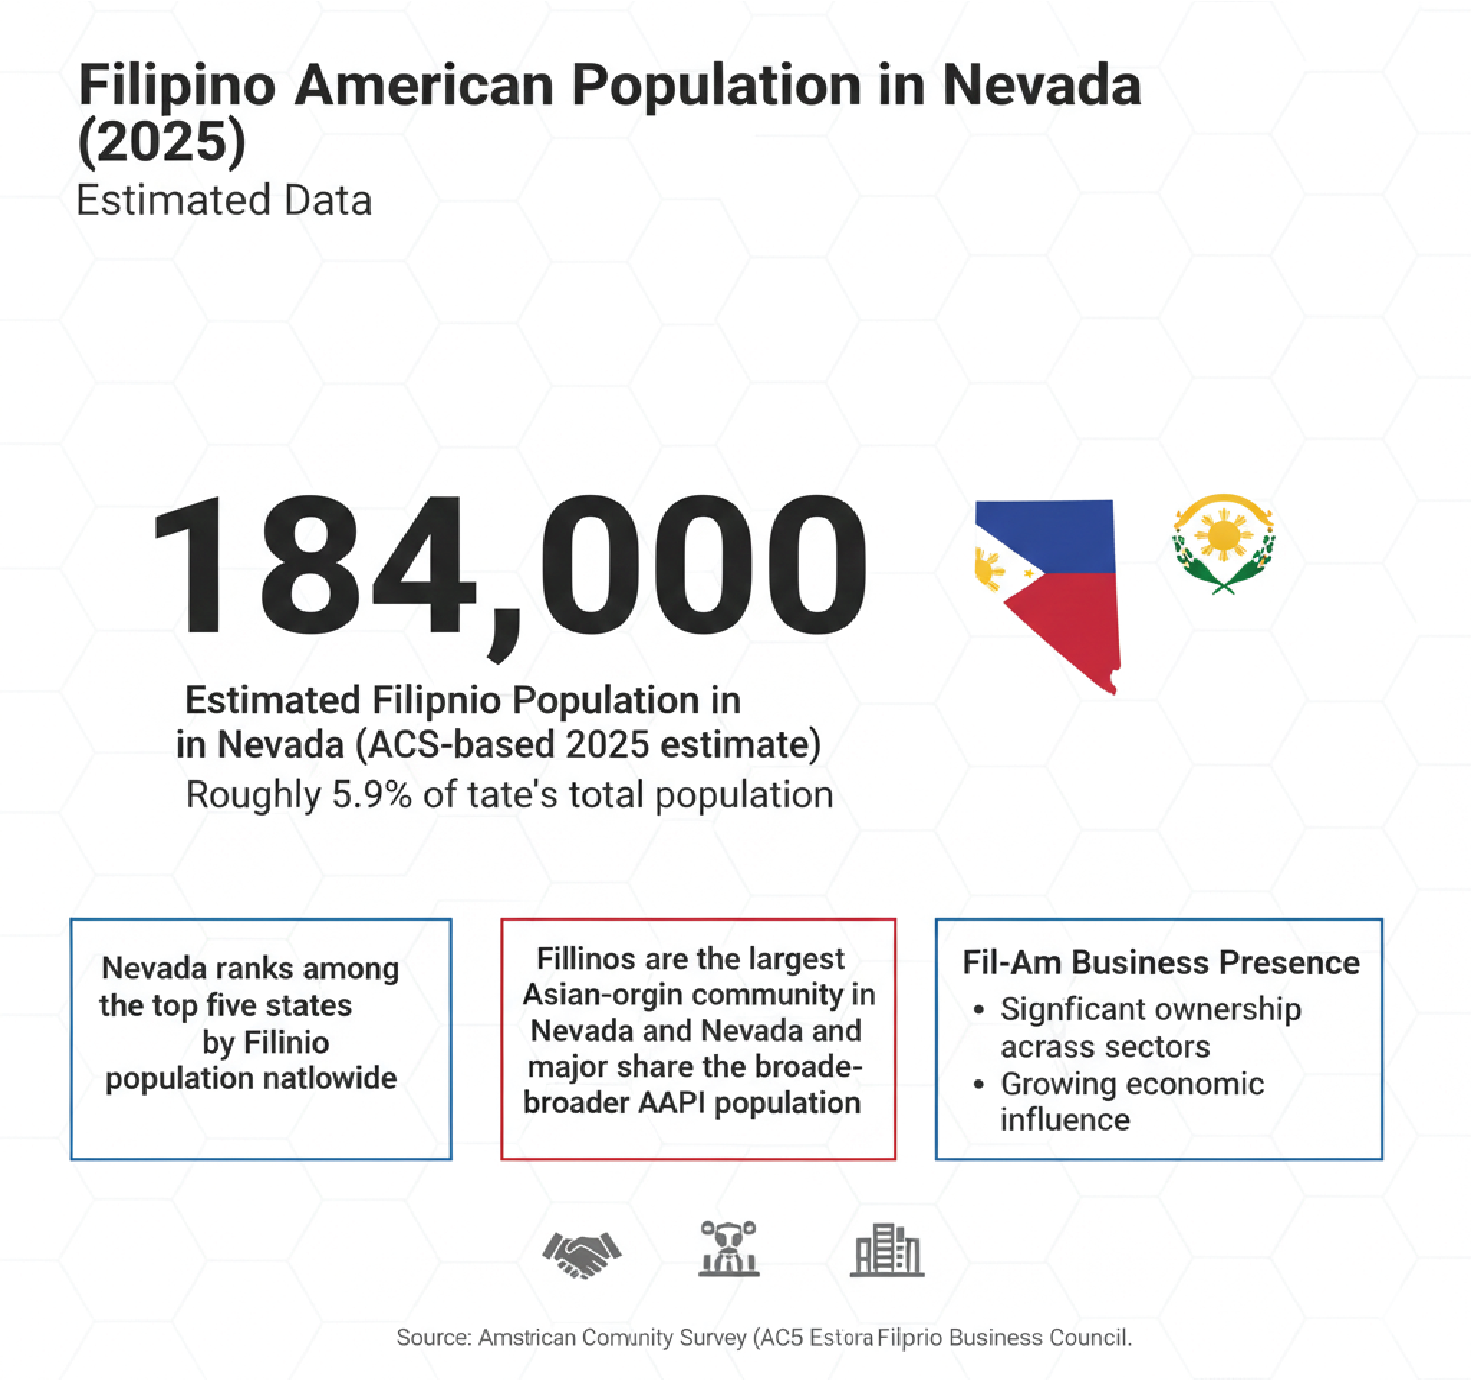
Estimated Filipino population in Nevada (ACS-based 2025 estimate): about 184,000 people, roughly 5.9% of the state’s population.[neilsberg]
Nevada ranks among the top five states by Filipino population nationwide.[neilsberg]
Filipinos are the largest Asian-origin community in Nevada and a major share of the broader AAPI population.wikipedia+1
Fil-Am business presence (national context, applied to Nevada)
Direct, Nevada-specific counts of Filipino-owned firms by industry are not published for 2025, so you have to infer from national AANHPI ownership patterns and the known concentration of Filipinos in Nevada:
AANHPI-owned firms represent about 11% of all employer businesses in the U.S. and are highly concentrated in services, especially accommodation and food services, retail trade, and health care.[epop.norc]
Nearly 1 in 5 employer businesses in the accommodation and food services sector nationally are Asian-owned, underscoring a strong presence in restaurants, hotels, and related hospitality.[epop.norc]
Given Filipinos’ large share of Nevada’s AAPI population, it is reasonable to assume Filipino Americans account for a substantial fraction of those Asian-owned firms in Nevada, especially in Southern Nevada (Las Vegas–Clark County corridor).aapichamber+1
Likely top sectors for Fil-Am–owned businesses in Nevada (2025)
This list reflects: (a) national sector patterns for Asian-owned businesses, (b) Nevada’s tourism- and service-heavy economy, and (c) visible Fil-Am business directories and community reports in Southern Nevada.filipinotownlvdirectory+2
Accommodation and food services
Restaurants (Filipino, pan-Asian, fusion), fast-casual concepts, cafés, bakeries, catering, and small hotel/motel operations are core areas.
Retail trade
Asian/Filipino grocery stores, water stores, specialty food shops, beauty and personal care retail, and small general merchandise stores serving both Filipino and broader Asian communities.
Health care and social assistance
Many Filipino Americans in Nevada work in nursing and allied health; some own home health agencies, adult daycare, behavioral health practices, and small outpatient or wellness services.pewresearch+1
Construction, real estate, and home services
Small contractors, remodeling and home improvement, landscaping, property management, and real estate brokerage, as reflected in local Fil-Am business directories
Professional, scientific, and technical services
Accounting and tax prep, consulting, marketing and design services, IT support, and other professional services, often oriented around small business and immigrant communities
Personal services and other services
Salons, spas, beauty services, event planning, photography, cleaning services, auto repair/detailing, and similar consumer-facing microbusinesses.
Approximate sector distribution (working framework)
Because Nevada does not publish a “Filipino-owned” cut of its business registry, you will likely need to model the distribution if you are doing planning, advocacy, or a grant/report. A reasonable, clearly-labeled estimate for Fil-Am–owned employer and nonemployer firms combined in Nevada could look like this, anchored to national AANHPI shares but adjusted for Nevada’s tourism economy:[epop.norc]
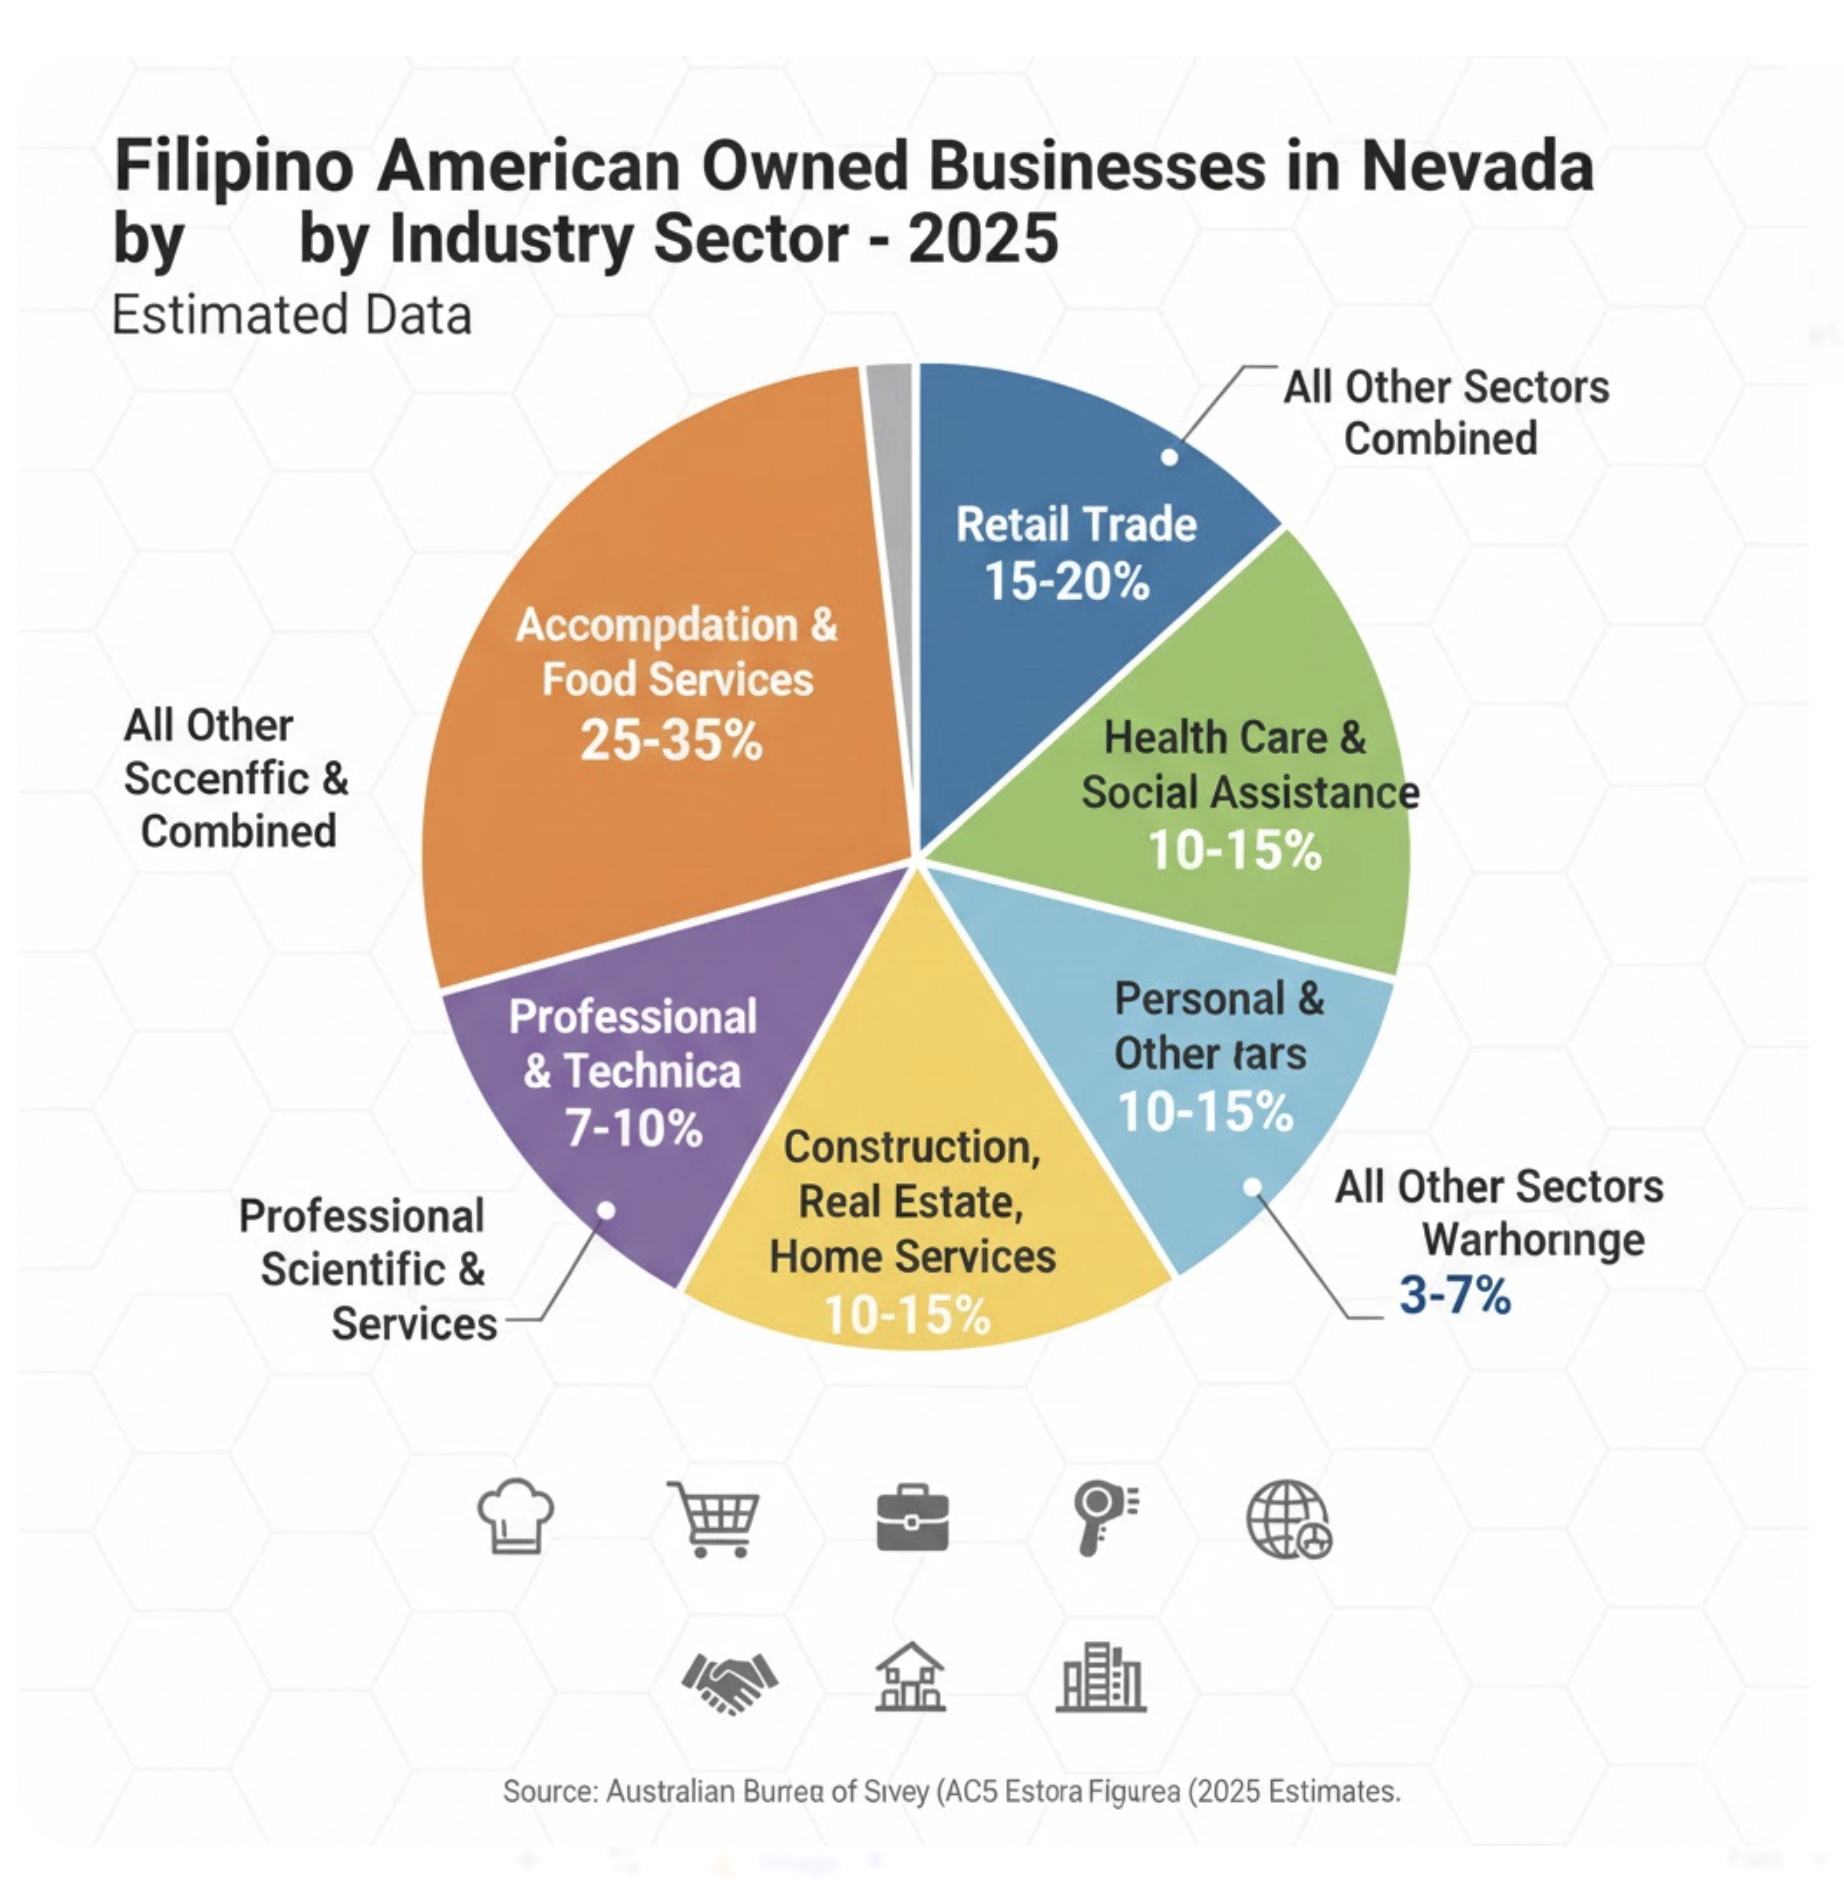
Broad sector Illustrative share of Fil-Am firms in NV (2025, modeled)
Accommodation & food services 25–35%, Retail trade1 5–20%, Health care & social assistance 10–15%, Construction, real estate, home services10–15%, Professional, scientific & technical services–10%, Personal & other services10–15%, Transportation & warehousing 3–7%.
All other sectors combined 5–10%
These are not official government numbers; they are a structured estimate that you can refine if you gain access to microdata (e.g., ABS microdata by owner ethnicity) or targeted local surveys.[epop.norc]